


AUD/USD in a range: Is a bullish breakout next?

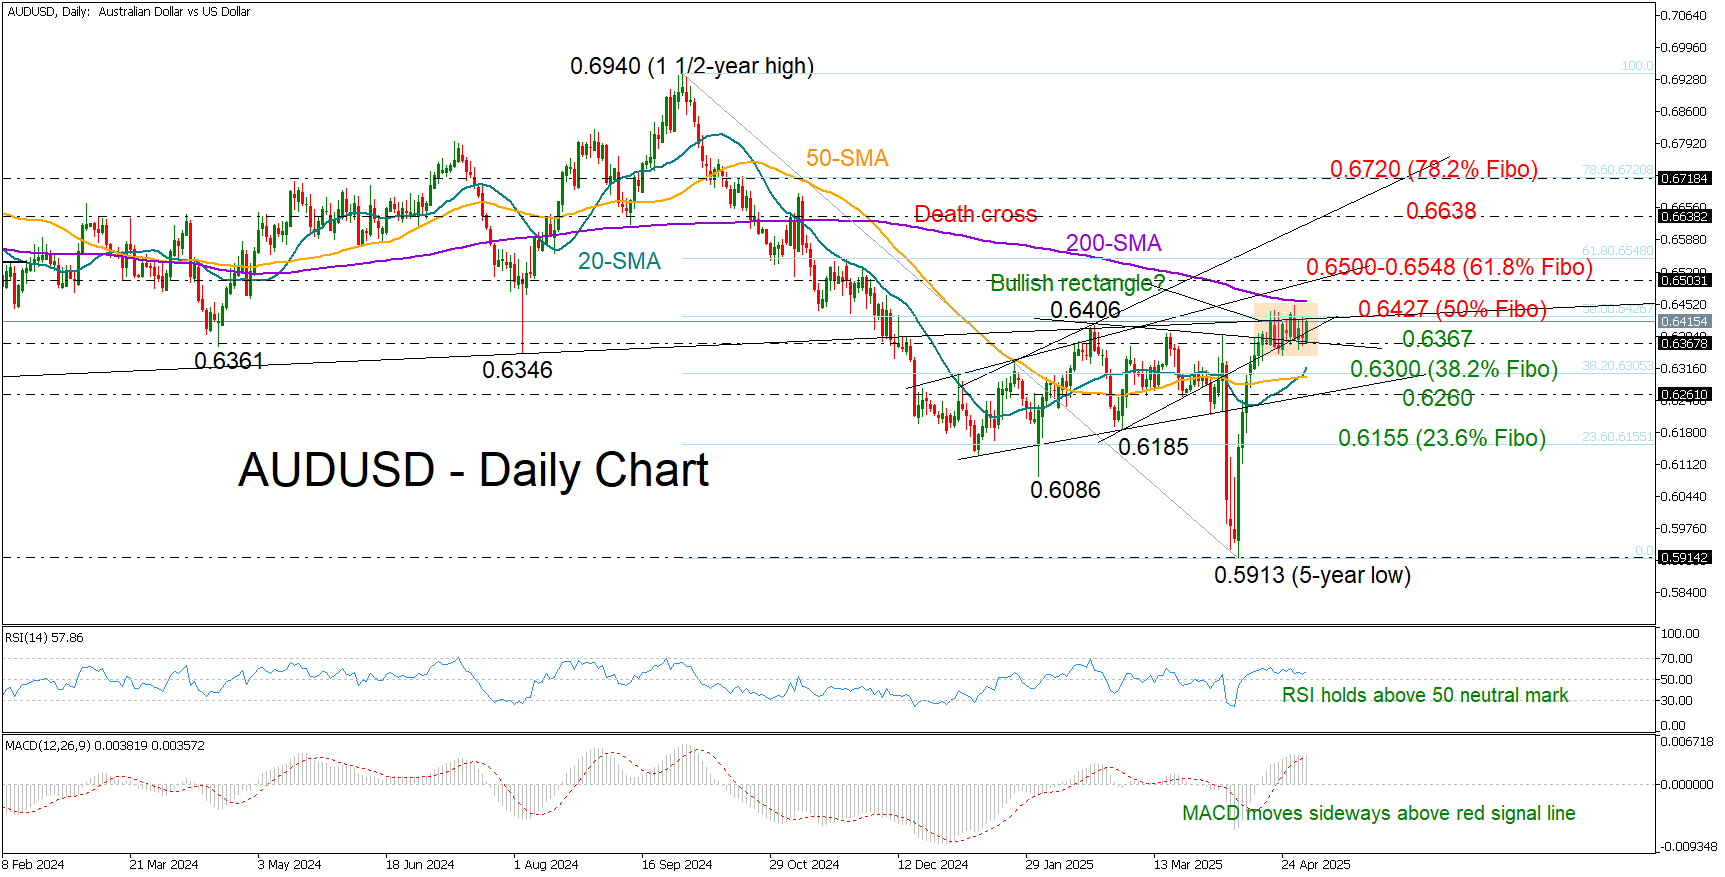
AUD/USD has been in a tight range for almost two weeks, consolidating its rapid rally from a five-year low below its 200-day simple moving average (SMA) and within the 0.6340-0.6448 area.
The 50% Fibonacci retracement of the September-April downtrend at 0.6427, along with the support-turned-resistance trendline from October 2023, has also posed a challenge for the bulls. However, with the RSI and the MACD fluctuating in the bullish area despite their sideways trajectory, hopes for an upward breakout remain alive ahead of the all-important US nonfarm payrolls. Additionally, the short-term sideways movement could be a bullish rectangle pattern, which typically resolves to the upside.
A move above the 200-day SMA at 0.6457 could initially stall somewhere between the 0.6500 psychological level and the 61.8% Fibonacci mark of 0.6548. A decisive break above the latter could trigger significant momentum toward the 0.6638 barrier, and potentially further to the 78.6% Fibonacci level at 0.6720.
In the bearish scenario, where the pair closes below 0.6367, the 20- and 50-day SMAs may help limit downside pressures near the 38.2% Fibonacci of 0.6300. Further congestion could occur around the 0.6260 area before a sharper decline toward the 23.6% Fibonacci level at 0.6155.
In a nutshell, although AUD/USD is maintaining a neutral short-term outlook, the technical indicators suggest that buyers remain active, likely awaiting a close above 0.6427 to regain control.

Daily Market Update: May 2, 2025

Todays economic news date poised to shape market sentiment as trade tensions and economic uncertainties linger: April 24, 2025

Markets experience subdued activity due to the Good Friday holiday: April 18, 2025

Continued Trade Tensions Steer Markets: April 15, 2025

Market's react to escalating trade tensions. Market Update: April 11, 2025

Market Update: April 9, Global Plays Shift

Global markets are reeling as U.S. President Donald Trump escalates trade tensions - April 8, 2025


